Customer question. "We run kgateway in front of our APIs and we want to bill customers by usage. The plan is to plug into a metering and billing system. Can the gateway be the point where usage is measured, so we get an accurate per-customer count without instrumenting every backend service, and without metering sitting in the request path where it could slow things down or take the API with it if it fails?"
kgateway is the one place every request already passes through, so it is the natural place to emit an event about each one. This lab does that with kgateway's native OpenTelemetry access-log sink: each request becomes an OTLP log record that is shipped to a collector. From there the stream can feed any events, observability, metering or billing backend, the sink is a choice, not part of the design. As a worked example we send it to OpenMeter and aggregate per-customer API usage. The backends are never touched, and because this reads the access log rather than gating the request, a collector or backend outage never reaches live traffic. It all runs on a single kind cluster with the open-source build of kgateway.
What you'll build
1 · gateway
OSS kgateway
Fronts an echo app. A ListenerPolicy emits one OTLP access-log
record per request, with the customer id as an attribute.
2 · tap
OTLP access log
The openTelemetry sink pushes records over OTLP/gRPC to the
collector. No stdout, no log scraping, no sidecar.
3 · collector
OpenMeter collector
The benthos-collector chart: otel_log in,
openmeter out. Maps each record to a CloudEvent.
4 · meter
OpenMeter
Self-hosted. Aggregates events into api_requests_total,
grouped by customer, method and route.
The billed identity is the subject of each usage event. In this lab
it comes from an x-customer-id request header so the flow is easy to
drive; in production you would take it from a validated JWT claim so a client
cannot spoof another customer's identity. Everything downstream is the same.
Step 1 — self-hosted OpenMeter
OpenMeter is an open-source (Apache-2.0) usage metering and billing engine. You
send it usage events as CloudEvents, define meters that aggregate them,
and query usage per customer in real time. This lab runs the self-hosted build
via its docker-compose quickstart, which brings up the API on
localhost:48888 and ships a preconfigured meter
api_requests_total (eventType: request, COUNT,
grouped by method and route), exactly what this pipeline emits.
bash scripts/00-openmeter.sh
git clone --depth 1 https://github.com/openmeterio/openmeter.git .openmeter
cd .openmeter/quickstart && docker compose up -d
# API comes up on http://localhost:48888
Step 2 — a minimal kind cluster and the Gateway API
A single-node kind cluster, then the upstream Gateway API standard CRDs that kgateway builds on.
bash scripts/01-cluster.sh
kind create cluster --config kind/cluster.yaml   # single node, name: kgw-metering

kubectl apply -f https://github.com/kubernetes-sigs/gateway-api/releases/download/v1.2.1/standard-install.yaml
Step 3 — install OSS kgateway
The open-source kgateway, no license. The CRDs chart first, then the control
plane. This registers the kgateway GatewayClass and the controller.
bash scripts/02-kgateway.sh
helm upgrade -i kgateway-crds \
  oci://cr.kgateway.dev/kgateway-dev/charts/kgateway-crds --version v2.2.0 \
  -n kgateway-system --create-namespace --wait

helm upgrade -i kgateway \
  oci://cr.kgateway.dev/kgateway-dev/charts/kgateway --version v2.2.0 \
  -n kgateway-system --wait
Step 4 — the backend, the Gateway and the route
A tiny echo app, a Gateway on the kgateway class (which
auto-provisions the Envoy proxy), and an HTTPRoute to the app.
yaml yaml/02-gateway.yaml
apiVersion: gateway.networking.k8s.io/v1
kind: Gateway
metadata:
  name: http
  namespace: kgateway-system
spec:
  gatewayClassName: kgateway
  listeners:
    - name: http
      protocol: HTTP
      port: 80
      allowedRoutes:
        namespaces: { from: All }
---
apiVersion: gateway.networking.k8s.io/v1
kind: HTTPRoute
metadata:
  name: echo
  namespace: demo
spec:
  parentRefs:
    - { name: http, namespace: kgateway-system }
  rules:
    - backendRefs:
        - { name: echo, port: 8080 }
Step 5 — the metering policy
This is the whole integration on the kgateway side: one ListenerPolicy
whose access-log sink is openTelemetry, pushing each request as an OTLP
log record to the collector. The access-log configuration sits at
spec.default.httpSettings.accessLog. The billed subject, and
the method and route we bill on, are carried as record attributes, taken straight off
the request with Envoy access-log operators.
yaml yaml/03-listenerpolicy.yaml
apiVersion: gateway.kgateway.dev/v1alpha1
kind: ListenerPolicy
metadata:
  name: metering-accesslog
  namespace: kgateway-system
spec:
  targetRefs:
    - group: gateway.networking.k8s.io
      kind: Gateway
      name: http
  default:
    httpSettings:
      accessLog:
        - openTelemetry:
            grpcService:
              backendRef:
                kind: Service
                name: otlp-collector
                namespace: telemetry
                port: 4317
              logName: "kgateway-metering"
            body: "%REQ(:METHOD)% %REQ(:PATH)% %RESPONSE_CODE%"
            attributes:
              values:
                - { key: subject, value: { stringValue: "%REQ(X-CUSTOMER-ID)%" } }
                - { key: method,  value: { stringValue: "%REQ(:METHOD)%" } }
                - { key: route,   value: { stringValue: "%REQ(:PATH)%" } }
                - { key: status,  value: { stringValue: "%RESPONSE_CODE%" } }
                - { key: id,      value: { stringValue: "%REQ(X-REQUEST-ID)%" } }
Step 6 — the OpenMeter collector
The collector is OpenMeter's Redpanda Connect build, installed from its Helm chart.
It listens for OTLP logs on :4317, maps each record to a CloudEvent with a
short bloblang expression, and sends it to OpenMeter with the native
openmeter output.
bash scripts/04-collector.sh
helm upgrade -i opentelemetry-collector \
  oci://ghcr.io/openmeterio/helm-charts/benthos-collector --version 1.0.0-beta.229 \
  -n telemetry --create-namespace -f yaml/collector-values.yaml --wait
yaml yaml/collector-values.yaml
fullnameOverride: opentelemetry-collector
openmeter:
  url: http://host.docker.internal:48888
  token: "local-no-auth"
service:
  enabled: true
  port: 4317
config:
  input:
    otel_log:
      address: 0.0.0.0:4317
  pipeline:
    processors:
      - mapping: |
          root.id = this.record.attributes.id.or(uuid_v4())
          root.specversion = "1.0"
          root.type = "request"
          root.source = "kgateway"
          root.subject = this.record.attributes.subject.or("anonymous")
          root.data.method = this.record.attributes.method
          root.data.route  = this.record.attributes.route
          root.data.status = this.record.attributes.status
  output:
    openmeter:
      url: ${OPENMETER_URL:http://host.docker.internal:48888}
      token: ${OPENMETER_TOKEN:local-no-auth}
Two small pieces of wiring finish the connection. The chart's default Service does
not expose the otel_log port, so we publish 4317 explicitly.
And because the policy is in kgateway-system while the collector is in
telemetry, the cross-namespace backendRef needs a
ReferenceGrant.
yaml yaml/04-collector-service.yaml
apiVersion: v1
kind: Service
metadata:
  name: otlp-collector
  namespace: telemetry
spec:
  selector:
    app.kubernetes.io/name: benthos-collector
  ports:
    - name: otlp-grpc
      port: 4317
      targetPort: 4317
      appProtocol: kubernetes.io/h2c
---
apiVersion: gateway.networking.k8s.io/v1beta1
kind: ReferenceGrant
metadata:
  name: allow-listenerpolicy-to-collector
  namespace: telemetry
spec:
  from:
    - group: gateway.kgateway.dev
      kind: ListenerPolicy
      namespace: kgateway-system
  to:
    - group: ""
      kind: Service
Step 7 — run it
Port-forward the gateway, send some traffic as two customers, and query OpenMeter.
bash drive traffic and read usage
kubectl -n kgateway-system port-forward svc/http 8080:80 &

curl -s -H 'x-customer-id: tesco'      http://localhost:8080/products/99
curl -s -H 'x-customer-id: tesco'      http://localhost:8080/basket -X POST
curl -s -H 'x-customer-id: sainsburys' http://localhost:8080/products/12
curl -s -H 'x-customer-id: sainsburys' http://localhost:8080/checkout -X POST

# per-customer usage from OpenMeter
curl -s "http://localhost:48888/api/v1/meters/api_requests_total/query?groupBy=subject" | jq
Within a couple of seconds the usage shows up in OpenMeter, attributed per customer and broken down by method and route, the dimensions a bill is built from:
| Customer | Method | Route | Billable calls |
|---|---|---|---|
tesco | GET | /products/99 | 5 |
tesco | POST | /basket | 5 |
sainsburys | GET | /products/12 | 5 |
sainsburys | POST | /checkout | 5 |
Each request also lands as a discrete event in the backend, one record per
request, tagged with the kgateway source, the request
type and the customer subject. That raw event stream is what the
meters aggregate over:
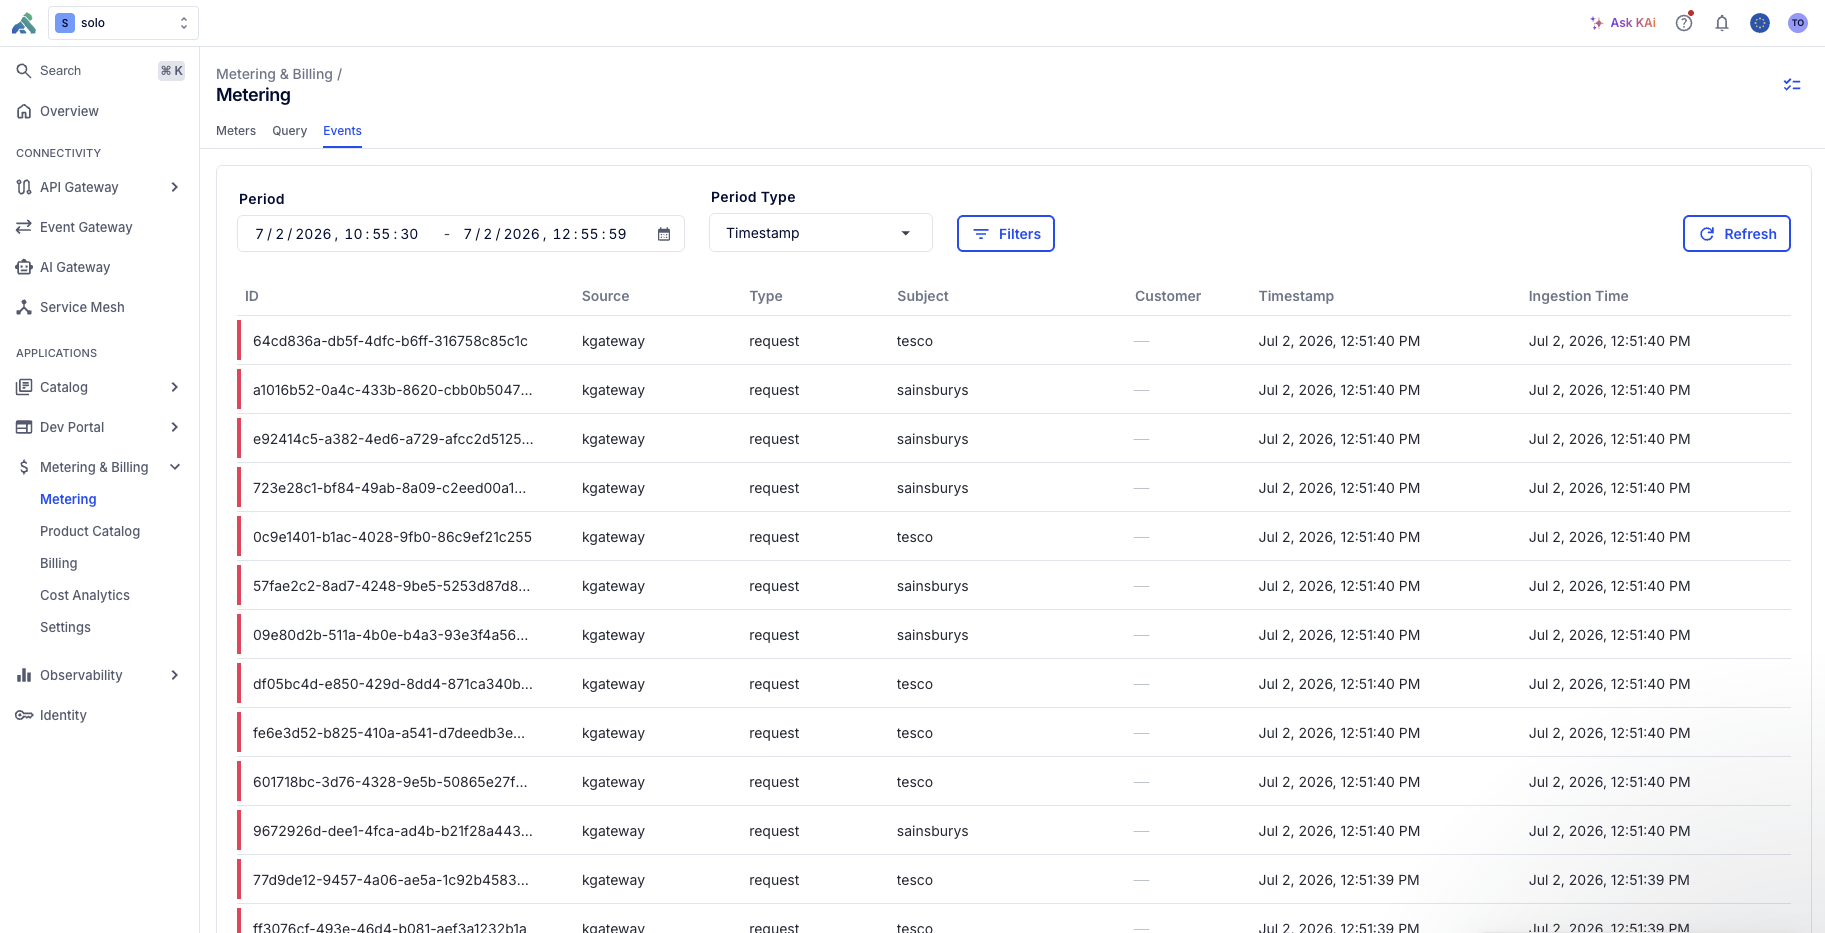
kgateway source and a customer subject. Self-hosted
OpenMeter is API-first; this Events view is OpenMeter's hosted console.
What happens when metering is down
Because metering reads the access log rather than gating the request, the answer is the important one: nothing happens to live traffic. If the collector or OpenMeter is unavailable, the APIs keep serving normally, there is no blast radius. The collector buffers records and retries with backoff, draining the backlog once the upstream returns, and OpenMeter deduplicates on the event id so retries never double-count. That is the difference between metering on the access-log path and metering inline in front of the request.
Taking the subject from a JWT claim
In the lab the billed subject is the x-customer-id header, which
is fine for driving the demo but a client could send any value. To bill the
authenticated identity, validate a JWT at the gateway and copy a claim into that
same header, using kgateway's native jwtAuth with claimsToHeaders.
Nothing downstream changes: the ListenerPolicy still reads
%REQ(X-CUSTOMER-ID)% and the collector mapping still reads
this.record.attributes.subject. You don't need an identity provider to try
it, the provider takes an inline JWKS, so a locally-minted token works.
A GatewayExtension holds the JWT provider. claimsToHeaders copies
the verified sub claim into x-customer-id, and because the value
now comes from a validated token, a client-sent header can no longer spoof it.
yaml jwt: GatewayExtension + TrafficPolicy
apiVersion: gateway.kgateway.dev/v1alpha1
kind: GatewayExtension
metadata:
  name: jwt-metering
  namespace: kgateway-system
spec:
  jwt:
    providers:
      - name: metering-idp
        issuer: https://issuer.example.com
        audiences: ["metering"]
        jwks:
          inline: |
            { "keys": [ { "kty": "RSA", "kid": "metering", "use": "sig",
                          "n": "<modulus>", "e": "AQAB" } ] }
        claimsToHeaders:
          - name: sub                 # the verified JWT claim
            header: x-customer-id      # copied into the header the access log reads
---
apiVersion: gateway.kgateway.dev/v1alpha1
kind: TrafficPolicy
metadata:
  name: jwt-metering
  namespace: kgateway-system
spec:
  targetRefs:
    - group: gateway.networking.k8s.io
      kind: Gateway
      name: http
  jwtAuth:
    extensionRef:
      name: jwt-metering
The token source defaults to the Authorization: Bearer header. With this in
place, subject becomes the authenticated user or tenant from the token rather
than a header the caller chose, and the metering pipeline is unchanged.
Taking it further
The same ListenerPolicy is all you change to point at a different target.
Against self-hosted OpenMeter the collector's native openmeter output is
the clean fit, which is what this lab uses. If any of the traffic is LLM or AI backends,
kgateway can carry token counts as access-log attributes, so the same pipeline meters
tokens as easily as it meters requests. And as shown above, the subject can come from a
validated JWT claim instead of a header with no change downstream.
Teardown
bash scripts/cleanup.sh
kind delete cluster --name kgw-metering
cd .openmeter/quickstart && docker compose down -v
See also
- Versioned cluster routing with kgateway
- kgateway vs Istio ingress, picking a north-south gateway
- OSS kgateway docs
- OpenMeter OpenTelemetry collector
Versions
Built and verified on:
v1.2.11.0.0-beta.229v2.2.0