The premise. When agents start chatting with frontier LLMs at production volume, the bill stops being theoretical. Token spend is the new cloud spend: it bursts unpredictably, it correlates with prompt length more than user count, and a single runaway loop in one team can drain the organisation's monthly budget in an afternoon.
Putting "stop the spend" in the agent code doesn't scale — every team writes
its own enforcement, every refactor risks bypassing it, and the audit story
becomes "look at N agents' logs". Putting it at the gateway means one
declarative budget per team, measured against the LLM's own
usage.total_tokens field, with one place to look when a team
asks "did we get throttled today?".
DBA team
5,000 tokens / hour
- Per day
- 50,000 tokens
- JWT claims
sub=dba,team=dba- Burns through
- ~4–6 long-essay prompts (400–1500 completion tokens each)
Support team
20,000 tokens / hour
- Per day
- 200,000 tokens
- JWT claims
sub=support,team=support- Burns through
- ~20+ prompts — comfortable headroom for the demo
What you'll build
Two agent Deployments running the same image — only the mounted JWT
Secret differs. On every request the gateway validates the JWT, stamps
X-Team-ID from jwt.team, and makes a gRPC
pre-flight check to the rate-limit-service (does the team
have any budget left?). If yes, it forwards to the LLM. When the response
comes back, the gateway parses usage.total_tokens and makes a
second gRPC call to debit that team's bucket in Redis.
The very next request from a team whose bucket is now over the line gets
HTTP 429. Prometheus scrapes both the gateway and the
rate-limit-service every 10s; the Grafana dashboard is a read-only view.
About — where Redis comes from (you don't deploy it, the chart does)
The rate-limit-service needs somewhere to store per-team counters that survives gateway restarts, holds the rolling-window state, and stays consistent across rate-limit-service replicas. The Solo enterprise-agentgateway helm chart installs a Redis Deployment for that purpose — you don't need to deploy it, configure it, or reference it from your own YAML.
What the chart installs
- Deployment
ext-cache-enterprise-agentgatewayin theagentgateway-systemnamespace, single replica, imagedocker.io/redis:7.2.13-alpinewith no overridden args (so it runs defaultredis-serverconfig). - Service
ext-cache-enterprise-agentgatewayon port6379. - Wiring — the rate-limiter pod's
REDIS_URLenv var is pre-set toext-cache-enterprise-agentgateway:6379. No configuration on your side.
Persistence: none, by default
The Redis pod uses an emptyDir volume mounted at
/data — not a PVC. There is no StatefulSet, no
volumeClaimTemplates, no --appendonly yes
arg on the Redis container. So:
- If the Redis pod restarts (rolling update, eviction, OOM, re-deploy of the chart), all per-team counters reset to zero. A team that was at 5,200/5,000 (over budget, getting 429s) suddenly has 0/5,000 again and resumes.
- For the lab, this is convenient — it's exactly the "reset
button" Scene 4 uses (
kubectl delete pod -l app=ext-cache) to demo bucket refill without waiting an hour. - For production, you'd flip the chart values to back Redis with
a PVC and enable AOF persistence (
--appendonly yes), or replace it with a managed Redis (ElastiCache, Memorystore, etc.) and pointREDIS_URLat that. The exact helm-value path depends on chart version — checkhelm show valuesfor theenterprise-agentgatewaychart'sextCache/cachesub-section.
Peeking at the buckets
The keys the rate-limiter writes look like
ratelimit_solo_io:<descriptor>. To see what's
in there right now:
kubectl -n agentgateway-system get deploy ext-cache-enterprise-agentgateway
kubectl -n agentgateway-system get svc  ext-cache-enterprise-agentgateway

# Peek at the actual counter keys + values:
POD=$(kubectl -n agentgateway-system get pod -l app=ext-cache -o name | head -1)
kubectl -n agentgateway-system exec "$POD" -- redis-cli --scan --pattern '*team*'
kubectl -n agentgateway-system exec "$POD" -- redis-cli GET '<the-key>'
Why budgets at the gateway
| Concern | In-agent token budget | vs | Gateway-enforced budget |
|---|---|---|---|
| Where the policy lives | Each agent's code or config — many copies, easy to drift | vs | One RateLimitConfig on the path every agent goes through |
| What counts as "tokens" | Whatever the agent decides to count (often just the request) | vs | The provider's usage.total_tokens — the same number the bill is based on |
| Identity model | Often baked into the agent's config — no per-team isolation | vs | One JWT per team; gateway projects jwt.team → X-Team-ID; rate-limit reads that header |
| Audit story | Each agent's stdout — N agents, N log shapes | vs | Single gateway counter + 429 line per rejection, scraped by Prometheus |
| Bypass risk | Anyone with code access can raise the limit | vs | Limit is in a CRD — change-control story is the same as any infrastructure policy |
Steps
1. Clone and bring it up
About — what this does & why
quick.sh up runs 01..07 in order, all idempotent.
Needs only a Solo Enterprise licence key — the chat agents talk to the
in-cluster mock LLM, not OpenAI, so no provider key is required.
Bashclone, set the license key, bring up the kind cluster
git clone https://github.com/tjorourke/solo-labs.git
cd solo/agentic-budgets-kind

export AGENTGATEWAY_LICENSE_KEY=...

./scripts/quick.sh up
./scripts/port-forward.sh   # leave running
Then open:
- http://localhost:8080 — kagent dashboard (both team agents)
- http://localhost:3000 — Grafana (admin / admin) → "Per-Team LLM Token Budgets"
2. The mock LLM (one Python file, deterministic usage)
About — why a mock instead of OpenAI
The lab is about the budget mechanism, not LLM quality. Hitting a
real provider during rehearsals would cost money and would make
"budget exhaustion in five prompts" hard to reproduce. The mock returns one
of 10 pre-baked essay templates and inserts a realistic
usage block; the gateway sees the same response shape it
would from real OpenAI.
Pythonsrc/mock-llm/server.py — handler excerpt (the bit the rate-limit reads)
async def chat_completions(request: Request) -> JSONResponse:
    body = await request.json()
    messages = body.get("messages") or []
    completion_text = random.choice(TEMPLATES)
    prompt_tokens     = _approx_prompt_tokens(messages)         # word_count × 1.3
    completion_tokens = random.randint(400, 1500)               # variable
    total_tokens      = prompt_tokens + completion_tokens

    return JSONResponse({
        "id": f"chatcmpl-{uuid.uuid4().hex[:24]}",
        "model": body.get("model") or "mock-essay-7b",
        "choices": [{"message": {"role": "assistant", "content": completion_text}}],
        "usage": {
            "prompt_tokens":     prompt_tokens,
            "completion_tokens": completion_tokens,
            "total_tokens":      total_tokens,    # ◄── the gateway debits this
        },
    })
3. The JWT issuer — identity for every request
About — why JWTs carry the identity
Per-team token budgets only make sense if the gateway knows which team
sent each request. The wire shape for "who" is a signed JWT — a token
carrying a team claim that the gateway verifies against the
issuer's public key. The gateway then projects the validated
jwt.team claim into an X-Team-ID request header
(a CEL transformation on the JWT policy — see section 4), and the
rate-limit configuration reads that header to pick the per-team bucket.
In production this is your existing IdP — Entra ID, Okta, Auth0, Keycloak.
The lab ships a small in-cluster issuer that mints the same standard-shape
JWTs (RS256, JWKS at /.well-known/jwks.json) so the whole
identity round-trip is visible end-to-end without standing up an external
IdP first. Each kagent chat agent mounts its team's token as
$LLM_JWT from a Secret and presents it on every LLM call —
it does NOT set X-Team-ID itself; the gateway stamps that
from the validated claim so a malicious caller can't spoof another
team's bucket.
Gosrc/jwt-issuer/main.go — claim shape (excerpt)
claims := jwt.MapClaims{
    "iss":  "agentic-budgets-kind",
    "sub":  "dba",
    "team": "dba",
    "iat":  now.Unix(),
    "exp":  now.AddDate(10, 0, 0).Unix(),
    "aud":  "mock-llm",
}
tok := jwt.NewWithClaims(jwt.SigningMethodRS256, claims)
tok.Header["kid"] = "agentic-budgets-key-1"
signed, _ := tok.SignedString(priv)
4. The gateway side — JWT auth + claim projection + token-based RateLimitConfig
About — three policies, one identity
Three things happen on every request before the LLM is even called:
- JWT validation. The gateway verifies the bearer token's signature against the JWKS served by jwt-issuer. Strict-mode — no token means 401 before reaching any backend.
- Claim projection. The same JWT policy includes a
transformation that sets
X-Team-IDfrom the validatedjwt.teamclaim. Thevalue:field of each header is a strict CEL expression, sovalue: jwt.teamresolves to the team string. The transformation usesset:notadd:, so any client-sentX-Team-IDis overwritten. - Token rate-limit. The
RateLimitConfighas one descriptor per team, each with a differentrequestsPerUnitceiling. TherequestHeadersaction readsX-Team-ID(just stamped by step 2) and matches against the right descriptor.type: TOKENdebits the response'susage.total_tokens, not the request count.
The agent does NOT set X-Team-ID itself — the gateway is
the source of truth, so a malicious caller can't spoof another team's
bucket by sending a different header value.
YAMLyaml/agentgateway/jwt-policy.yaml — JWT auth + claim → header projection
apiVersion: enterpriseagentgateway.solo.io/v1alpha1
kind: EnterpriseAgentgatewayPolicy
metadata: { name: jwt-auth, namespace: agentgateway-system }
spec:
  targetRefs:
    - { group: gateway.networking.k8s.io, kind: Gateway, name: budgets-gateway }
  traffic:
    jwtAuthentication:
      mode: Strict
      providers:
        - issuer: "agentic-budgets-kind"
          audiences: ["mock-llm"]
          jwks:
            remote:
              jwksPath: "/.well-known/jwks.json"
              backendRef: { group: "", kind: Service, name: jwt-issuer, namespace: budgets, port: 8080 }
    transformation:
      request:
        set:
          - name: X-Team-ID
value: jwt.team # ← strict CEL expression, resolves to the team claimYAMLyaml/agentgateway/ratelimit-config.yaml — the entire budget
apiVersion: ratelimit.solo.io/v1alpha1
kind: RateLimitConfig
metadata: { name: team-token-budget, namespace: agentgateway-system }
spec:
  raw:
    descriptors:
      - key: team
        value: "dba"
        rateLimit: { requestsPerUnit: 5000,  unit: HOUR }
      - key: team
        value: "support"
        rateLimit: { requestsPerUnit: 20000, unit: HOUR }
    rateLimits:
      - actions:
          - requestHeaders:
              descriptorKey: "team"
              headerName: "X-Team-ID"
type: TOKENYAMLyaml/agentgateway/ratelimit-policy.yaml — attach to the LLM route
apiVersion: enterpriseagentgateway.solo.io/v1alpha1
kind: EnterpriseAgentgatewayPolicy
metadata: { name: team-budget, namespace: llm }   # same namespace as llm-route
spec:
  targetRefs:                                      # local refs — no namespace field
    - { group: gateway.networking.k8s.io, kind: HTTPRoute, name: llm-route }
  traffic:
    entRateLimit:
      global:
        rateLimitConfigRefs:
          - { name: team-token-budget, namespace: agentgateway-system }
5. The agent side — identical code, different JWT
About — two agents, one image
The two kagent Agent CRs apply the same BYO image; only the
mounted JWT Secret differs. The agent reads $LLM_JWT once at
startup and passes it on every /v1/chat/completions request.
No langchain LLM client — a plain httpx.AsyncClient.post, so
the 429 surfaces verbatim instead of being eaten by a retry layer.
Pythonsrc/langgraph-agent/agent.py — _call_llm (excerpt)
async with httpx.AsyncClient(timeout=REQUEST_TIMEOUT) as client:
    resp = await client.post(LLM_URL, json=payload, headers={
        "Authorization": f"Bearer {LLM_JWT}",            # ◄── identity
        "Content-Type":  "application/json",
    })

if resp.status_code == 429:
    return (
        f"Sorry — your team's LLM token budget is exhausted. "
        f"Please try again later. (HTTP 429 from the gateway; "
        f"team={TEAM_LABEL!r}.)"
    )
…
return resp.json()["choices"][0]["message"]["content"]
Walk through the demo
Open http://localhost:8080 in one tab and
http://localhost:3000 in another. In Grafana, navigate to the
"Per-Team LLM Token Budgets" dashboard. Now run through four scenes.
Scene 1 — Baseline: both teams idle
dba-agent and support-agent. Neither has been prompted yet.RateLimitConfig.
Scene 2 — DBA burns through its hourly budget
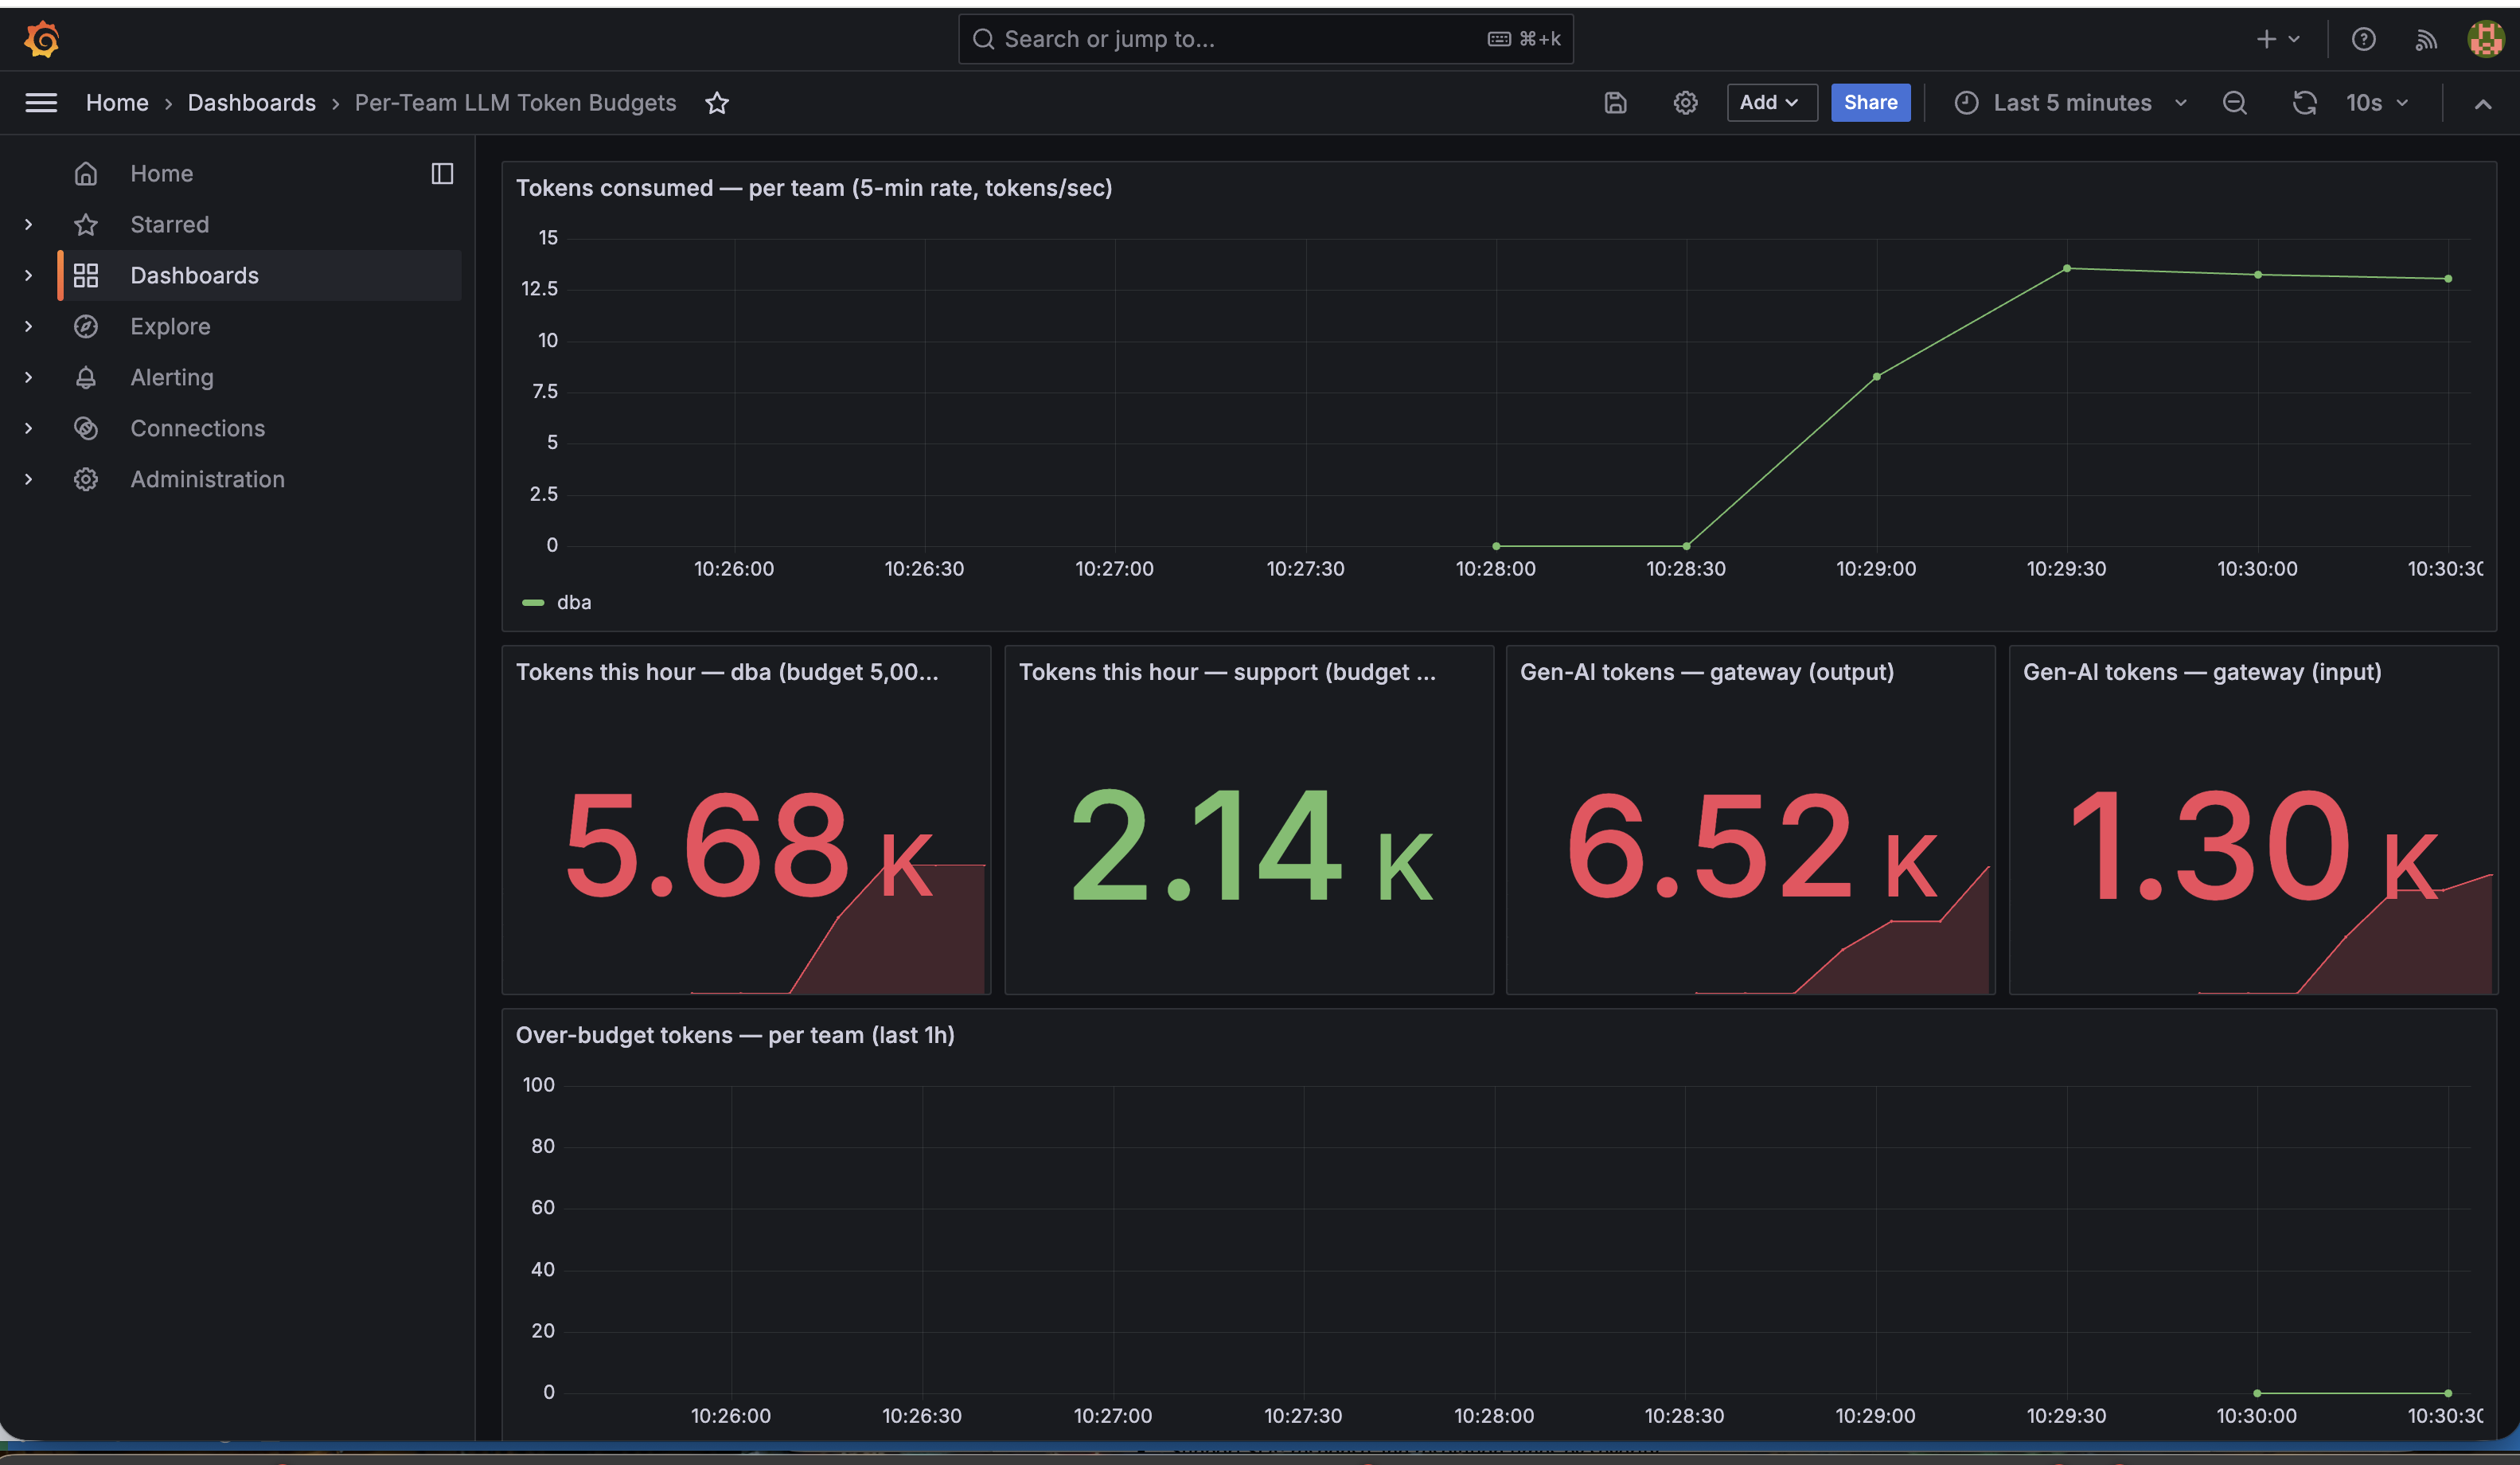
dba tile turned red after crossing 5k tokens. The gateway is reading usage.total_tokens off each response and debiting the per-team bucket — these numbers are the same ones the cloud bill would be based on.usage.total_tokens field directly off the response body and
debiting the per-team bucket. The number on the dashboard is the same
number the cloud bill would be based on — not a request count, not a
pre-flight estimate. Real spend.
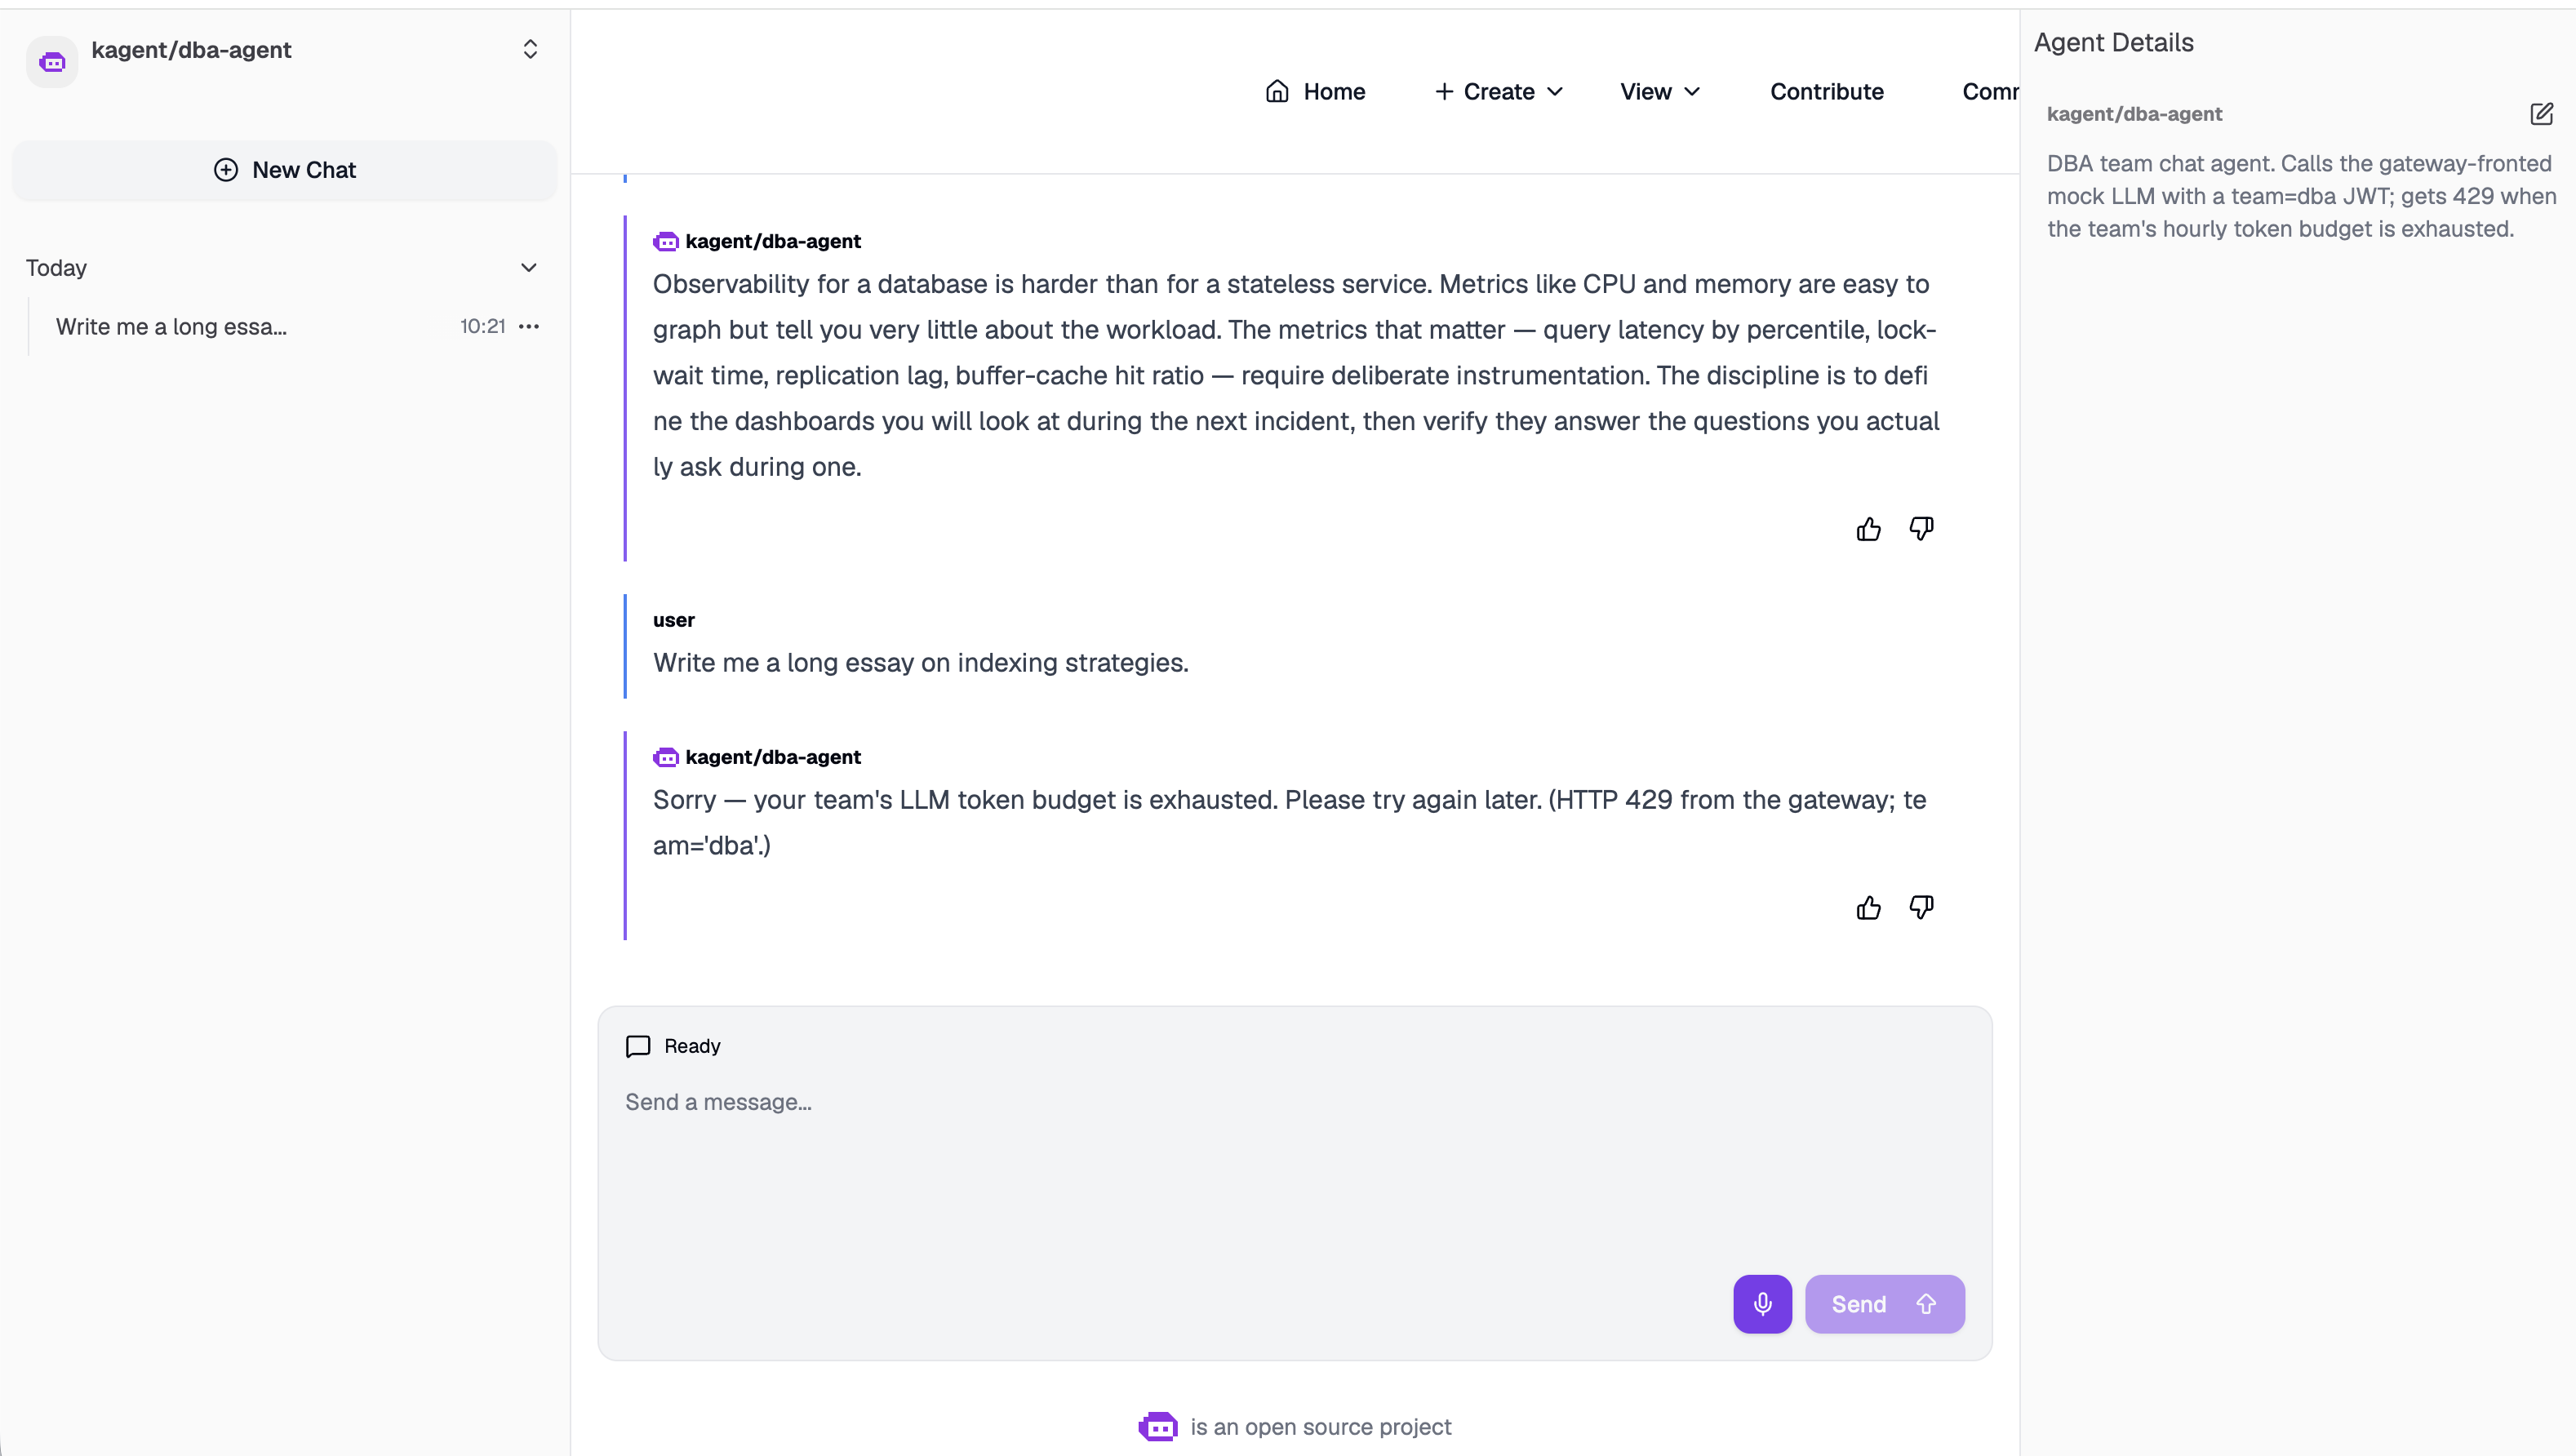
Scene 3 — DBA blocked; Support unaffected
'dba'.)” That's
the raw 429 from the gateway, surfaced through the agent's chat output.
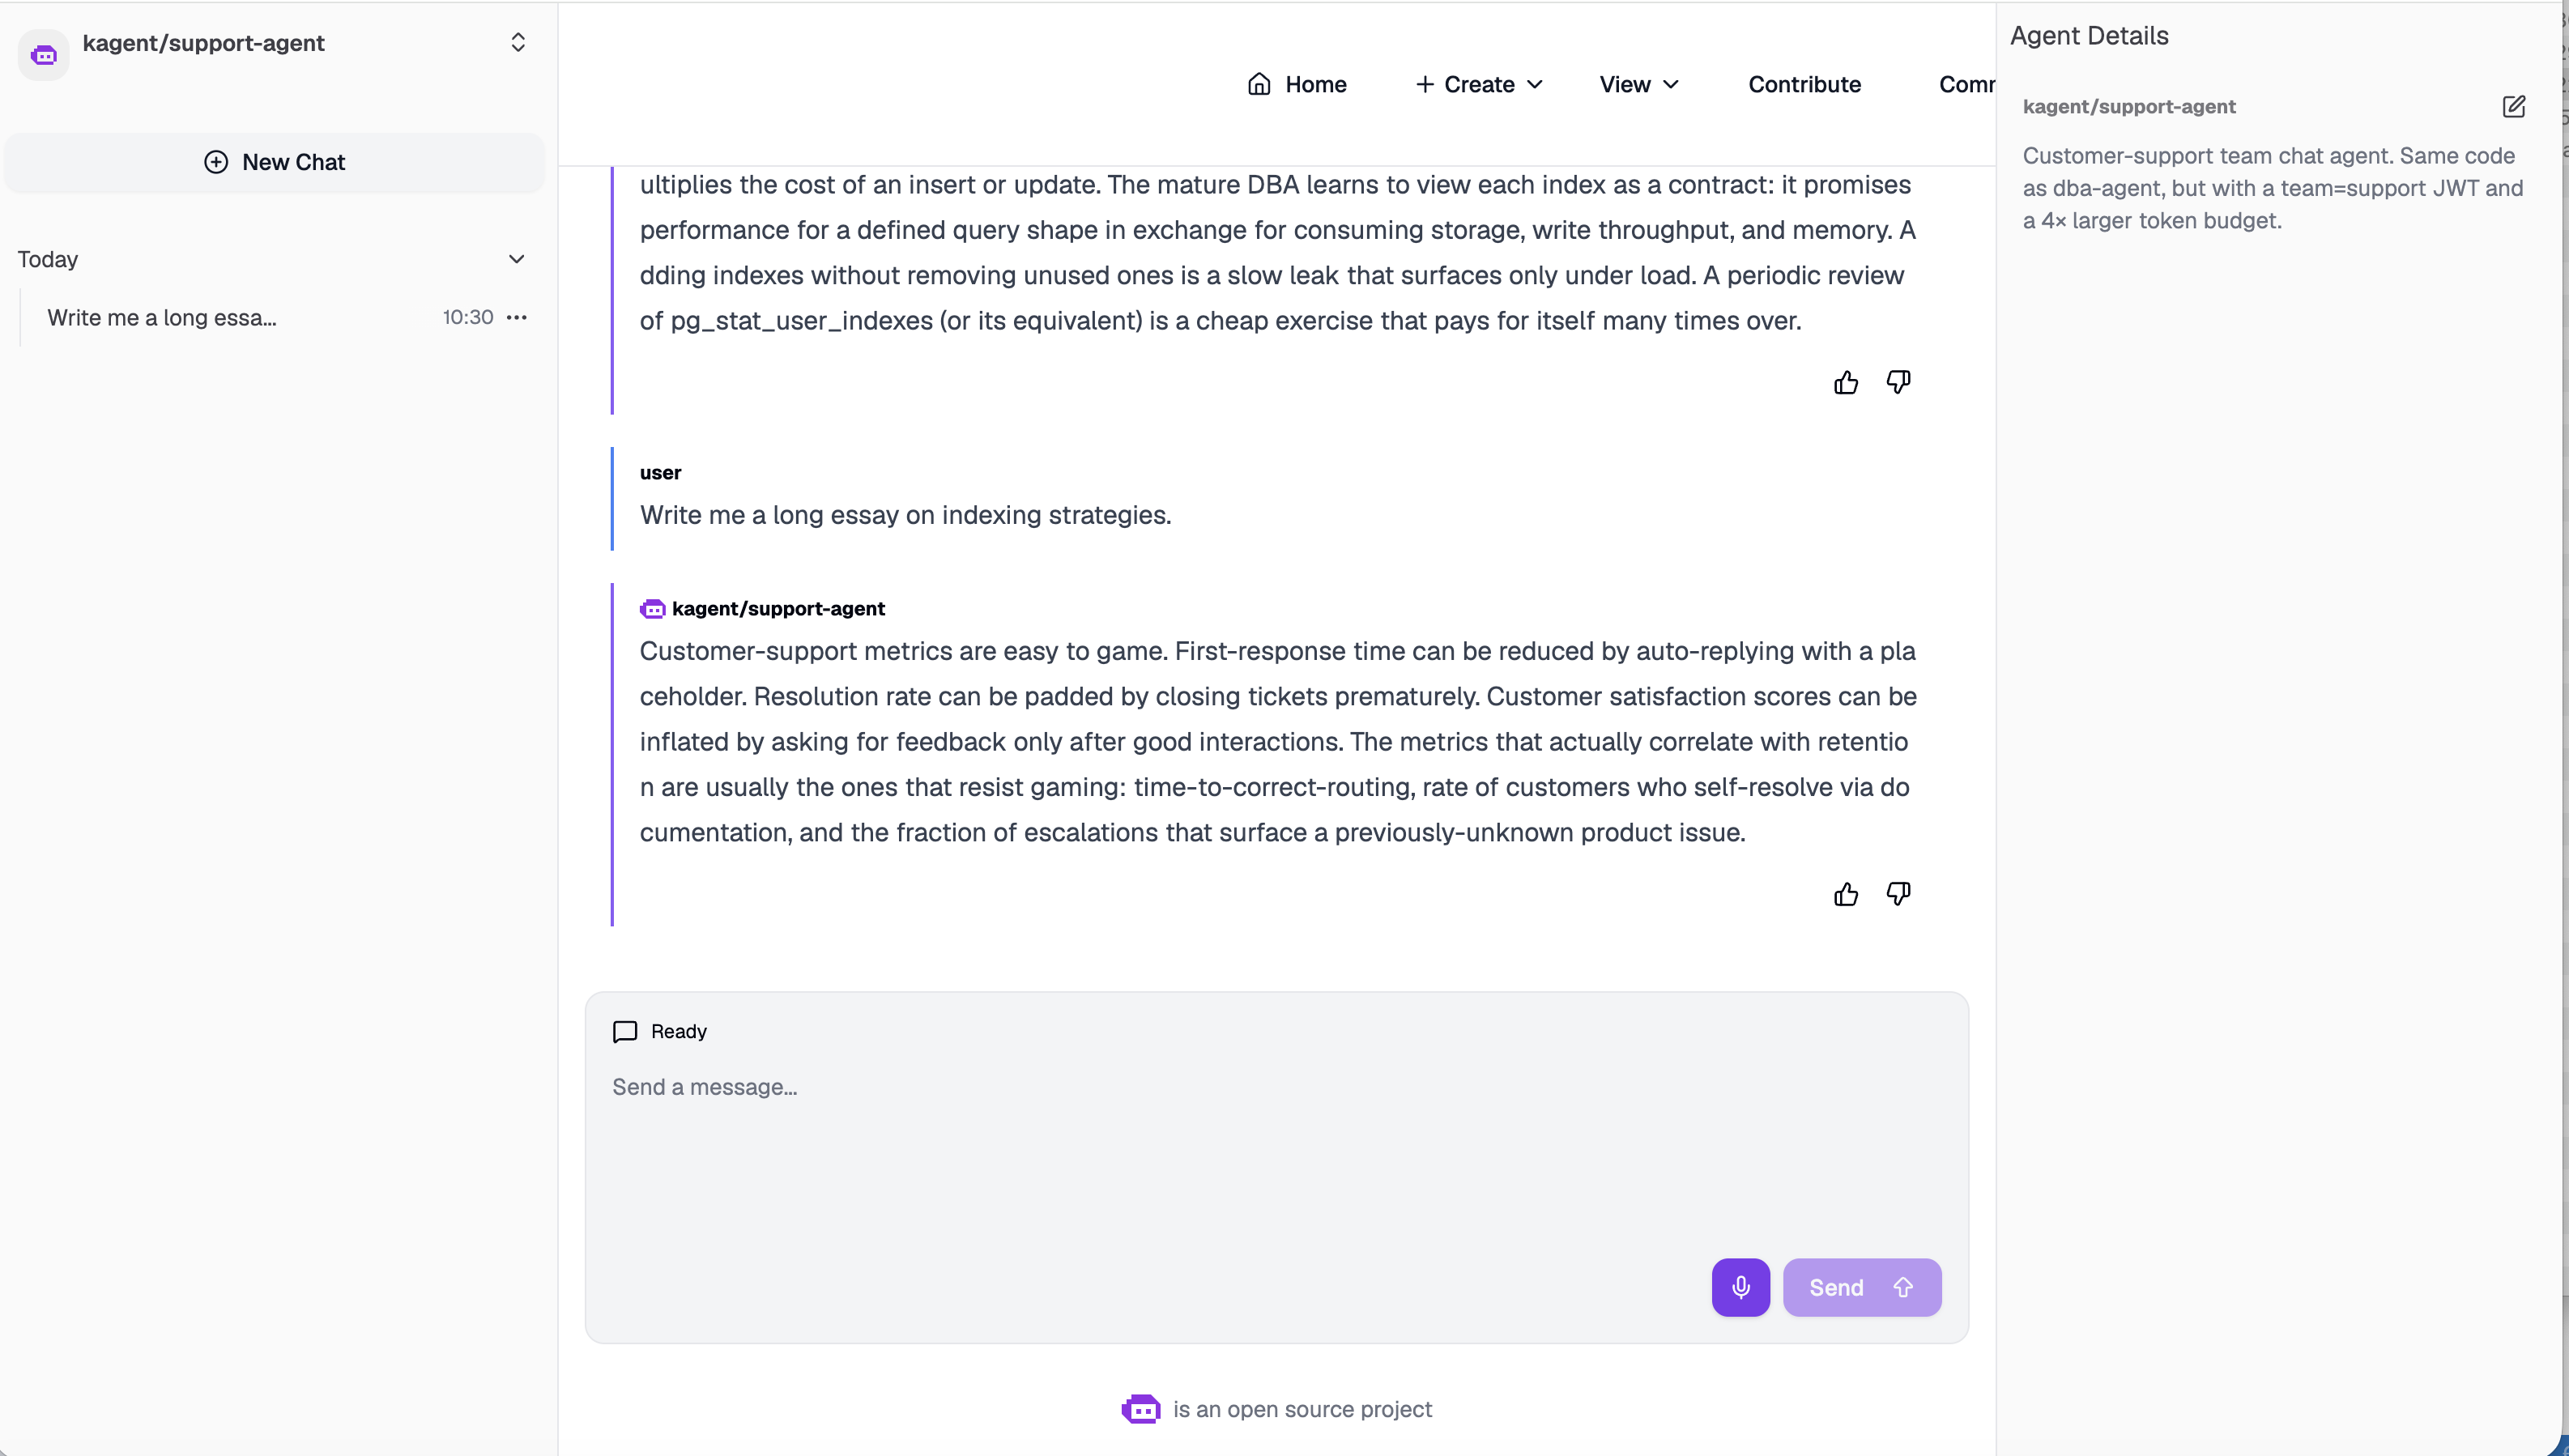
Scene 4 — Reset: the bucket refills
dba-agent and prompt again. Normal essay response, dashboard climbing from zero again.Going per-user: token counts in access logs
Everything above keys on the team. The bucket key is just a descriptor, so the
same shape works per user: swap the jwt.team claim for a per-user
identity like jwt.sub and each distinct user gets their own bucket.
The lab mints distinct per-user identities (alice and
bob on the dba team, carol on support) so you can see
real per-user usage even while the budget stays keyed per team.
Runs on kind. This is wired up and validated end to end. The
gateway stamps user_id and the token counts on every access line,
Promtail ships them to Loki, and the Grafana dashboard shows a per-user token
table, a per-user log panel, and a per-user tokens-over-time chart, sitting
next to the per-team budget panels. Bring it up with
./scripts/quick.sh up and open the dashboard.
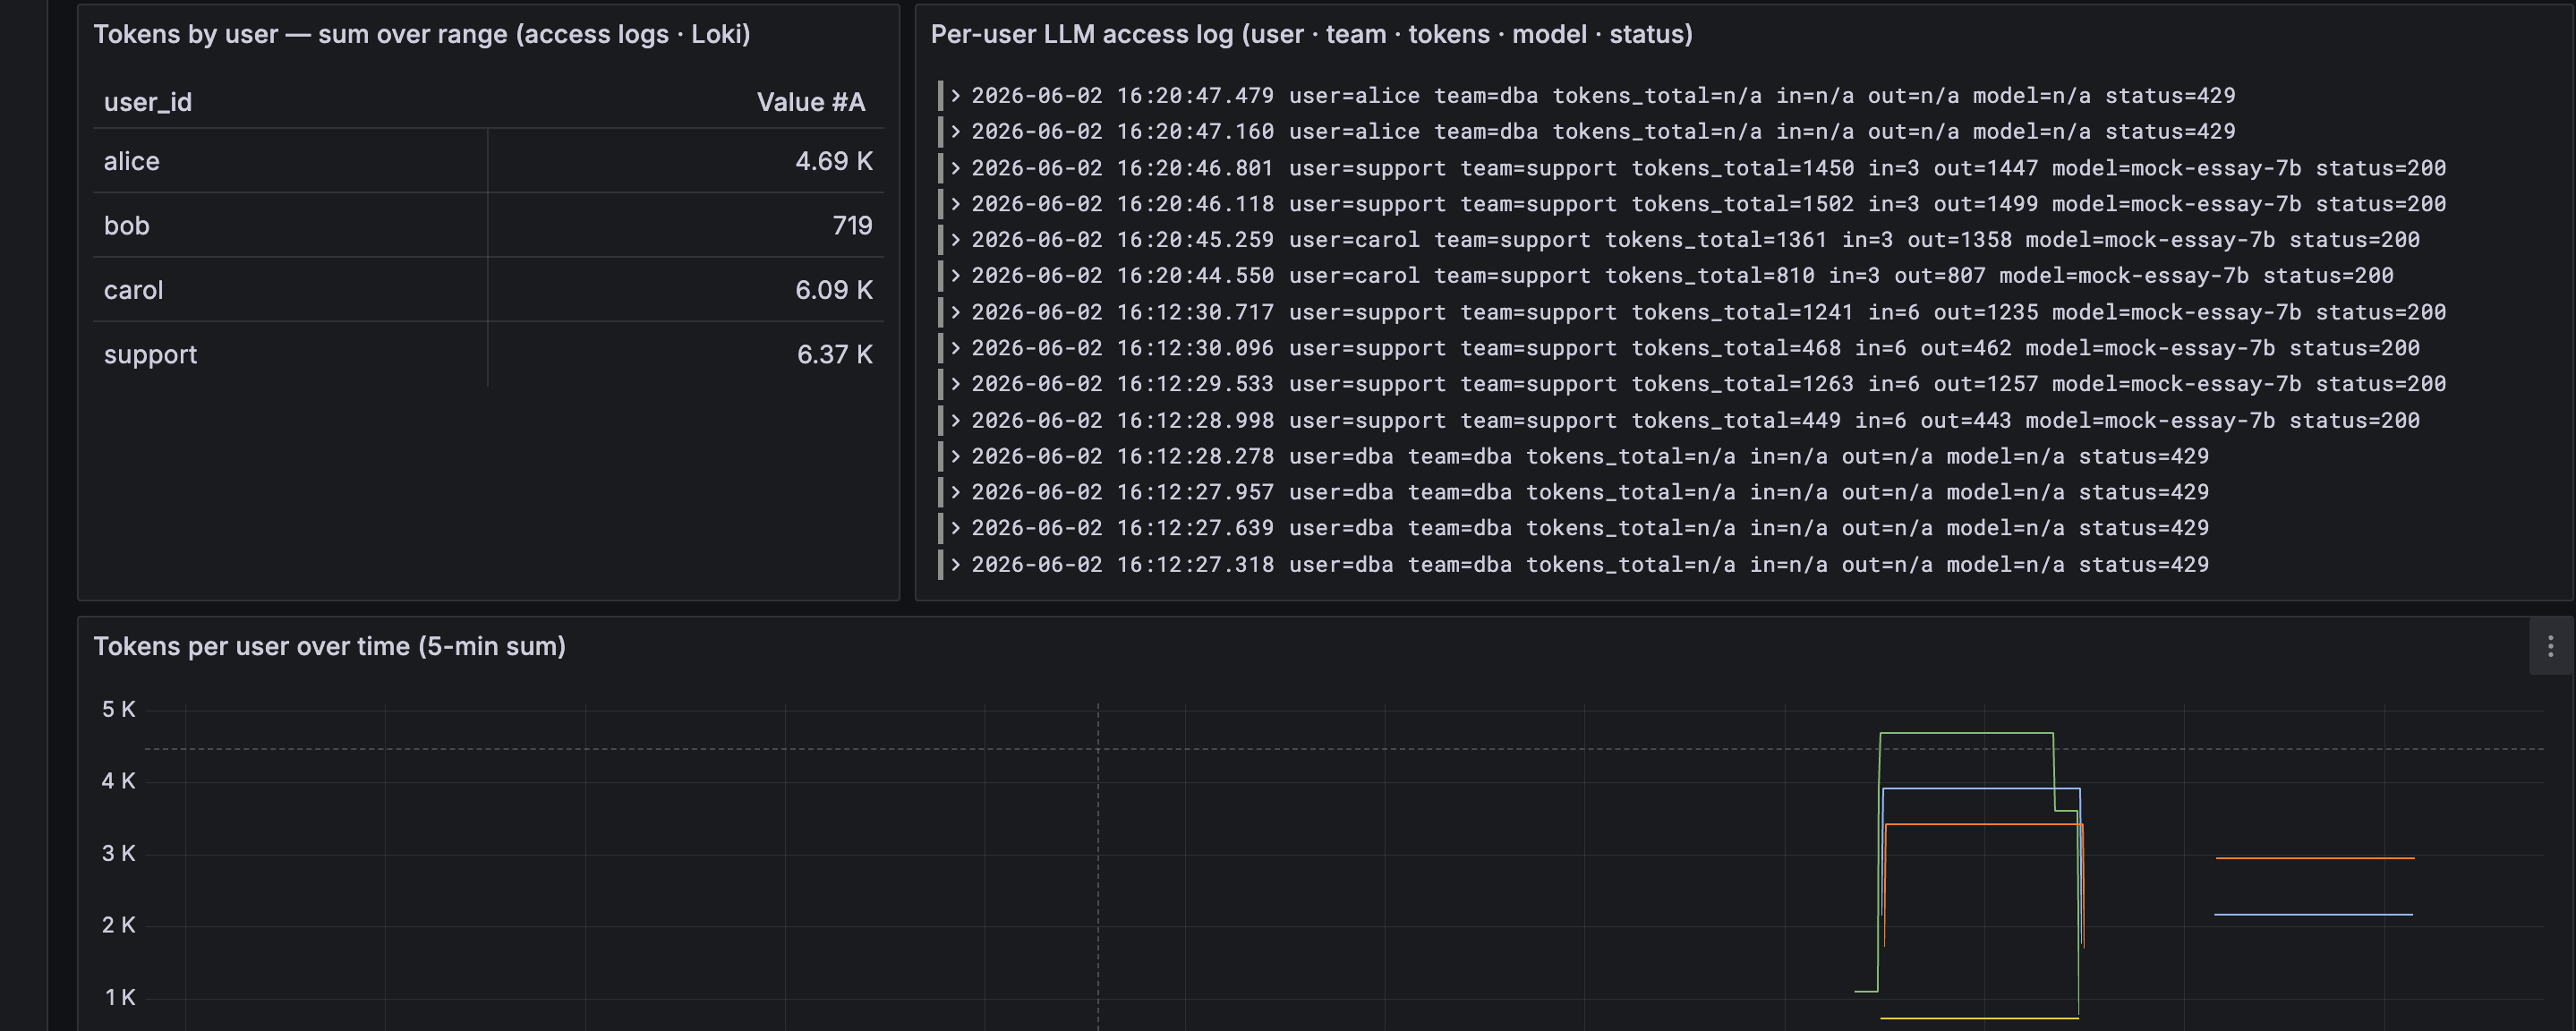
user_id and token counts (right), and tokens per user over time (bottom). Click to enlarge.Enforcement and visibility are two separate jobs, though. The rate-limit counter caps spend, but to actually see per-user token counts you want the numbers attributed to an identity. You could add a per-user label to the Prometheus token metric, but a label per user becomes one live time series per user, which gets expensive at thousands of users. Access logs avoid that: the identity rides in the log payload, not as a live series, and you sum tokens per user at query time in the log store. Keep Prometheus for the aggregate dashboard, use access logs for the per-user breakdown.
Add the attribution with a second policy on the Gateway. The llm.*
token variables are available in the logging context, and jwt.sub
gives you the identity:
YAMLper-user token attribution on the access log
apiVersion: enterpriseagentgateway.solo.io/v1alpha1
kind: EnterpriseAgentgatewayPolicy
metadata:
  name: token-attribution-logging
  namespace: agentgateway-system
spec:
  targetRefs:
    - group: gateway.networking.k8s.io
      kind: Gateway
      name: budgets-gateway
  frontend:
    accessLog:
      attributes:
        add:
          - { name: user_id,      expression: 'default(jwt.sub, "unknown")' }
          - { name: tokens_total, expression: 'default(string(llm.totalTokens), "n/a")' }
          - { name: tokens_in,    expression: 'default(string(llm.inputTokens), "n/a")' }
          - { name: tokens_out,   expression: 'default(string(llm.outputTokens), "n/a")' }
          - { name: model,        expression: 'default(llm.responseModel, "n/a")' }
          - { name: status,       expression: 'string(response.code)' }
Every LLM request now logs a line carrying
user_id=… tokens_total=… model=… status=….
In the demo the proxy writes to stdout, so you can sum per user straight off the
pod logs:
Bashsum tokens per user from the gateway access log
kubectl --context kind-budgets -n agentgateway-system logs deploy/budgets-gateway \
  | grep -oE 'user_id=[^ ]+ .*tokens_total=[0-9]+' \
  | awk '{for(i=1;i<=NF;i++){if($i~/^user_id=/)u=substr($i,9);
          if($i~/^tokens_total=/)t=substr($i,14)} sum[u]+=t}
         END{for(u in sum) printf "%-16s %d tokens\n", u, sum[u]}'
# dba      18342 tokens
# support   9551 tokens
In production you ship the logs off-box instead of tailing a pod. The same
frontend.accessLog has an otlp sink: point it at an
OpenTelemetry collector and forward to Loki, Elastic, BigQuery, or whatever you
run, then aggregate there.
YAMLexport access logs to a collector, then aggregate in the log store
  frontend:
    accessLog:
      attributes:
        add: [ ... as above ... ]
      otlp:
        backendRef:
          kind: Service
          name: otel-collector
          namespace: monitoring
          port: 4317

# Then, per-user tokens in Loki:
#   sum by (user_id) (
#     sum_over_time({app="budgets-gateway"} | logfmt | unwrap tokens_total [1h])
#   )
Watch out for a few things. Use
spec.frontend.accessLog.attributes.add, not
spec.config.logging.fields.add, they are different structures. Wrap integer
llm.* values in string() with a default()
fallback, as above. Do not add a has(llm) filter guard; it
compile-panics the proxy, so leave the filter field off and non-LLM
requests simply show n/a. The llm.* token variables
live in the logging and metrics context only, not in rate-limit or
transformation policies, so this attribution is configured separately from the
budget enforcement even though both key off the same JWT claim.
Try it: generate per-user data and view it in Grafana
The lab mints a JWT Secret per user (jwt-alice, jwt-bob,
jwt-carol, plus jwt-dba / jwt-support) in
the kagent namespace. You do not need the chat agents for this:
point curl at the gateway and replay each user's token. alice and
bob are on the dba team, so they share the dba 5,000/hour bucket
and you will see some 429s once it is spent. carol and
support are on the support team and keep flowing.
Bashreplay a few requests per user through the gateway
# forward the gateway so curl can reach it
kubectl --context kind-budgets -n agentgateway-system \
  port-forward svc/budgets-gateway 8090:80 &

# fire 5 requests as each user, using their minted JWT
for u in alice bob carol support; do
  TOK=$(kubectl --context kind-budgets -n kagent \
    get secret jwt-$u -o jsonpath='{.data.token}' | base64 -d)
  for i in $(seq 1 5); do
    curl -s -o /dev/null -X POST http://localhost:8090/v1/chat/completions \
      -H "Authorization: Bearer $TOK" -H "Content-Type: application/json" \
      -d '{"model":"mock-essay-7b","messages":[{"role":"user","content":"write an essay about databases"}]}'
  done
  echo "sent 5 requests as $u"
doneBashlog in to Grafana and open the per-user panels
# forward Grafana (port-forward.sh also does this)
kubectl --context kind-budgets -n monitoring \
  port-forward svc/monitoring-grafana 3000:80 &

# open http://localhost:3000  →  log in  admin / admin
# →  dashboard "Per-Team LLM Token Budgets"
# →  scroll to the "Tokens by user", "Per-user LLM access log",
#     and "Tokens per user over time" panels at the bottom
Within a few seconds Promtail ships the new access lines to Loki and the
per-user panels fill in, one row and one line per user_id, while
the per-team budget panels above keep enforcing the bucket.
Talking points
- Token spend is the new cloud spend. Treat it like cloud budgets: per-team accountability, alerts before the ceiling, a 429 response that's not a panic but a soft signal “you're at your monthly limit”.
- The gateway reads the LLM's own meter. The bucket is
debited by
usage.total_tokens— the same number the provider's bill is calculated from. Not a request count. Not a pre-flight estimate. - JWT is the only identity story. CEL on
jwt.teamdrives the bucket key. Swap the in-cluster issuer for Keycloak, Entra, Okta — same policy shape, new JWKS URL. - Two agents, one image. The agent code is
identity-agnostic. The team is the JWT, nothing else. Adding a third
team means a third Secret, a third Agent CR, and a four-line addition
to the
RateLimitConfig. - The 429 surfaces verbatim. The agent uses raw
httpxon purpose — no langchain retry layer eats the response. The user sees the gateway's decision in plain English.
Teardown
./scripts/quick.sh teardownSee also
- Solo docs — LLM rate limiting
- Solo docs — JWT authentication
- Sibling lab — Per-User MCP Tool RBAC on the same stack
- Sibling lab — Two-layer HITL for an MCP agent
Versions
Built and verified on:
v2.3.4v1.4.0